Go to top
European Commission logo
English
RAMI website

lidar_co_sgl

Single collided waveform LIDAR return signal

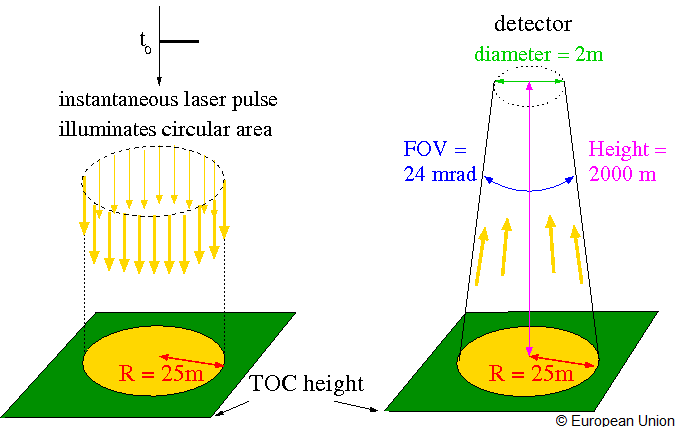
This measurement involves the simulation of the return signal of a waveform LIDAR accounting only for the first order of scattering of radiation within the canopy.

  • The lidar_co_sgl measurement is to be carried out using the spectral properties defined for the GED (e.g. 1064 nm) spectral band in the case of actual canopies. , and the NIR spectral regime in the case of abstract canopies.
  • The laser pulse giving rise to the lidar_co_sgl measurement can be assumed to be a delta function, i.e., all photons arrive at the same moment in time at the top-of-canopy height level.
  • The laser pulse results in a circular footprint of 50 m diameter at the top-of-canopy height level. The center of this illuminated disc lies at $x=50m$, $y=50m$ for scenes having the origin of their coordinate system in the lower left hand corner of the scene) and $x=0m$, $y=0m$ otherwise (that is for scenes having the origin of their coordinate system in the center of the scene).
  • The lidar_co_sgl measurement is to be carried out excluding the solar illumination conditions that are defined on the webpage describing the RAMI canopy scene. Instead the entire canopy scene is illuminated in a uniform manner with an incident zenith angle $\theta_i=0^\circ$. (except for the constant slope test cases where the illumination conditions are IZA = 15 and 30 degree, depending on whether the cylinders are inclined at 15 or 30 degrees, respectively). The illumination azimuth angle (counted in an anticlockwise manner from the positive x-axis towards the positive y-axis) is then irrelevant and can be set to $\phi_i=0^\circ$ or $180^\circ$.
  • Only the first order of scattering (from the canopy constituents and background surface) contribute to the lidar_co_sgl measurement.
  • The footprint area from where photons may contribute to the waveform Lidar signal is equal to a circle of 50 m diameter (this implies that lidar_co_sglmeasurement is not to be applied to the abstract homogeneous canopies which are smaller in size). The center of this circular footprint area coincides with the illuminated disc-shaped area at the top-of-canopy, that is, the center of the circular IFOV lies at x=50, y=50 for scenes having the origin of their coordinate system in the lower left hand corner of the scene) and x=0, y=0 otherwise (that is, for scenes having the origin of their coordinate system in the center of the scene).
  • The waveform signal is to be simulated for 20 height bins, that are contained within the maximum ($z_{max}$) and minimum ($z_{min}$) canopy heights (provided on the description page of every RAMI scene). The waveform height bin interval thus is $h/20$.
  • The field of view (FOV) of the detector is 2 × 12 mrad. The height of the detector is 2000 m. The radius of the telescope collecting the returned photons is 1 metre.
  • The quantity to report is the ratio of incident radiation within the footprint area divided by the amount of radiation that is scattered back up from a given height into the field of view of the detector. Beware, however, that the quantity of interest is not reported in terms of photon path length nor in terms of the time it takes to hit the detector but rather in terms of the height in the canopy where the last physical interaction occurred before the radiation hits the detector. Should your model not be able to generate this information then please contact the RAMI coordinators here.
lidar transmission
lidar transmission

Header

Header line content Header line format
# rows %4d
# columns in file %4d
heigth level interval %.6f

Columns content

Content Format
mean height level of bin [m] %.6f
return signal [-] %.10f
standard deviation of return signal* %.10f

*: if not available set to −1.0000000000.

The order in which the return signal from different height bins are listed in the measurement files is from the bottom of the canopy ($z_{min}$) towards the top of the canopy ($z_{max}$) height levels, as outlined below:

	20	3	0.050000
0.025000 0.0000001427 -1.0000000000
0.075000 0.0000000001 -1.0000000000
0.125000 0.0000000001 -1.0000000000
0.175000 0.0000000002 -1.0000000000
0.225000 0.0000000003 -1.0000000000
0.275000 0.0000000008 -1.0000000000
0.325000 0.0000000011 -1.0000000000
0.375000 0.0000000014 -1.0000000000
0.425000 0.0000000016 -1.0000000000
0.475000 0.0000000019 -1.0000000000
0.525000 0.0000000025 -1.0000000000
0.575000 0.0000000028 -1.0000000000
0.625000 0.0000000037 -1.0000000000
0.675000 0.0000000041 -1.0000000000
0.725000 0.0000000022 -1.0000000000
0.775000 0.0000000029 -1.0000000000
0.825000 0.0000000018 -1.0000000000
0.875000 0.0000000021 -1.0000000000
0.925000 0.0000000012 -1.0000000000
0.975000 0.0000000002 -1.0000000000