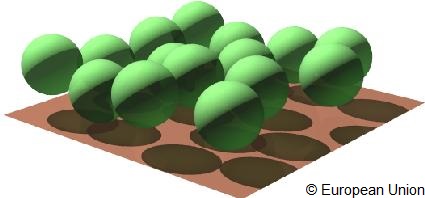
This set of experiments was suggested to simulate the radiative transfer regime in the red and near infra-red spectral bands for heterogeneous environmental scenes composed of a large number of non overlapping spherical objects representing the individual plant crowns, located over and only partially covering a horizontal plane standing for the underlying soil surface.
These objects, in turn, contained a 'gas' (to be treated as a turbid medium) of dimension-less particles representing the leaves. These scattering particles were characterized by specified radiative properties (reflectance, transmittance), and the orientation of the normals to the scatterers followed exclusively a uniform distribution function. The radiative properties of the underlying soil were also specified (in this case a simple Lambertian scattering law). The particular values selected for these input variables represented classical plant canopy conditions.
This figure exhibit a graphical representation of such a scene, from the side.
This figure exhibit a graphical representation of such a scene, from the top.
The zero azimuth line is defined along the northern direction and coincides with the positive x axis as indicated in the diagram below:
The zero azimuth line.
Scene dimensions:
( X × Y × Z)
100.0 × 100.0 × 30.0 [m × m × m]
(Xmin, Ymin, Zmin)
−50.0, −50.0, 0.0 [m, m, m]
(Xmin, Ymax, Zmin)
−50.0, +50.0, 0.0 [m, m, m]
(Xmax, Ymin, Zmin)
+50.0, −50.0, 0.0 [m, m, m]
(Xmax, Ymax, Zmin)
+50.0, +50.0, 0.0 [m, m, m]
(Xmin, Ymin, Zmax)
−50.0, −50.0, 30.0 [m, m, m]
(Xmin, Ymax, Zmax)
−50.0, +50.0, 30.0 [m, m, m]
(Xmax, Ymin, Zmax)
+50.0, −50.0, 30.0 [m, m, m]
(Xmax, Ymax, Zmax)
+50.0, +50.0, 30.0 [m, m, m]
Scatterer shape
Disc of negligible thickness
Scatterer radius
0 or close to 0 [m]
LAI of individual sphere
5.0
Scatterer normal distribution
Uniform
Number of spheres
15
Fractional scene area coverage of spheres
0.471
Sphere radius
10.0 [m]
Minimum sphere center height
11.0 [m]
Maximum sphere center height
19.0 [m]
where the Leaf Area Index (LAI) is calculated as follows:
LAI = (# of leaves × one-sided area of single leaf) ⁄ ( π × square of the radius of sphere)
The coordinates
(X, Y, Z) of the sphere centers are as follows:
−24.8302; 11.6110; 15.6210
−38.3380; −9.06342; 17.6094
−31.3562; 32.5297; 14.3051
11.9126; 8.32062; 12.1220
39.4855; 37.1247; 16.3647
−8.30999; −4.39422; 14.4241
12.2769; −25.1402; 12.4492
32.4756; −26.9023; 16.3684
−7.46991; −32.2138; 12.6678
−27.4794; −32.0266; 15.9146
33.5709; −6.31039; 14.5332
−5.24326; 39.8405; 16.8247
18.1699; 35.8223; 11.5683
−5.26569; 18.9618; 17.2535
37.8226; 14.6769; 11.5936
The underlying soil is occupying the entire lower surface of the scene, i.e., the area enclosed between the following coordinates: (−50.0, −50.0, 0.0), (−50.0, +50.0, 0.0), (+50.0, −50.0, 0.0), and (+50.0, +50.0, 0.0), where all values are in meters.
The tables below provide the details required to execute each of the experiments in this category.
The tables below provide the details required to execute each of the experiments in this category. Every table is preceeded by the corresponding experiment identifier that is needed in the naming of the various measurement results files (see file naming and formatting conventions).