
Thresholded hemispherical photograph (binary fisheye image)
This measurements involves determining the binary probability (i.e., 0 or 1) of seeing the sky when looking up into a particular direction from a given location at the bottom of the canopy. In order to simulate results similar to those obtained from hemispherical photographs the thp measurement requires to simulate 250000 directions uniformly distributed throughout the upper hemisphere. If a given RT model is not able to simulate individual directions then solid angles should be chosen that are as small as possible (and this value should then be reported to the RAMI coordinators via a report files). More specifically,
RAMI scenes that have the origin of the coordinate system in the lower left corner of the scene: feature the following x,y,z locations for the thp measurements:
RAMI scenes that have the origin of the coordinate system in the center of the scene: feature the following x,y,z locations for the thp measurements:
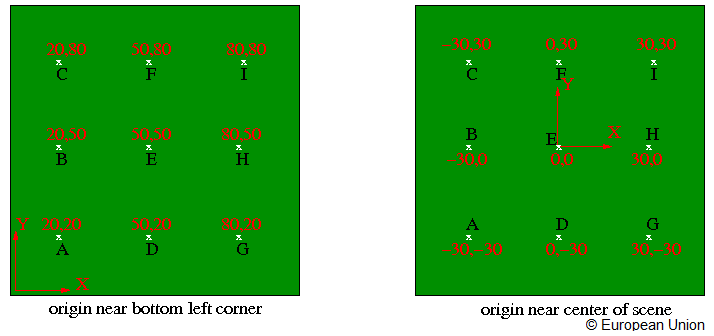
At each of the above nine locations in a given RAMI scene, the thp measurements are to be taken at a height of 0.05 m and for 250000 directions that are uniformly distributed across the upper hemisphere. This number is but a fraction of the pixels that are available in actual digital cameras currently used for field inventories! An ASCII file with the exact (zenith angle & azimuth angle) directions can be found here. In order to be able to carry out the thp measurements at all angles in the upper hemisphere the finite-sized RAMI scenes are to be added an infinite number of times to the outsides of themselves (in other words cyclic boundary conditions apply).
In RAMI-V, the naming strategy foresees a spectral and a geometry tags which are not defined in this measure, then they should be set to "UND" (ex. HET07_JPS_SUM_UND_UND-thp-raytran.mes). The results for the nine different positions A-I are reported in columns 3-11 of a unique file as described below.
| Header line content | Header line format |
|---|---|
| # rows | %4d |
| # columns in file | %4d |
| hemisphere tag | %4d |
| Content | Format |
|---|---|
| $\theta_r$ [rad] | %.10f |
| $\phi_r$ [rad] | %.10f |
| transmission probability for Location A | %4d |
| transmission probability for Location B | %4d |
| transmission probability for Location C | %4d |
| transmission probability for Location D | %4d |
| transmission probability for Location E | %4d |
| transmission probability for Location F | %4d |
| transmission probability for Location G | %4d |
| transmission probability for Location H | %4d |
| transmission probability for Location I | %4d |
where:
(first few lines for a dirgapf measurement in a determinstic canopy scene)
250000 3 1
1.5694883253	0.0048036585	0	0	0	0	0	0	0	0	1
1.5694883253	0.0144109755	0	1	0	1	0	1	0	1	0
1.5694883253	0.0240182925	0	0	0	0	0	0	0	0	0
1.5694883253	0.0336256094	1	1	1	1	1	1	1	1	1
1.5694883253	0.0432329264	1	0	0	1	1	0	0	1	1
1.5694883253	0.0528402434	0	1	0	1	0	1	0	1	0
1.5694883253	0.0624475604	0	1	0	1	0	1	0	1	0
1.5694883253	0.0720548774	0	1	0	1	0	1	0	1	0
1.5694883253	0.0816621944	1	1	0	1	0	1	0	1	0
1.5694883253	0.0912695113	0	1	0	1	0	1	0	1	0
1.5694883253	0.1008768283	1	1	0	1	0	1	0	1	0
1.5694883253	0.1104841453	0	0	0	0	0	0	0	0	0
1.5694883253	0.1200914623	0	1	1	1	1	1	1	1	1
...