Anisotropic background
Scene description for Anisotropic background environments
Constant Slope
Scene description for Constant Slope environments
Two-layer canopy
Scene description for Two-layer canopy environments

RAMI IV phase
This page provides access to ABSTRACT canopy representations with HETEROGENOUS distributions of scatterers (Foliage). Three different scenarios are proposed that feature 1) anisotropic background conditions (snow, bare soil, vegetation), 2) heterogeneous over and understoreys, and 3) a constant slope of the background. Graphical visualizations of these environments are available via the respective links below.
For any model m that simulates a BRF in a given band (λ), viewing (Ωv) and illumination (Ω0) geometry over a surface target with structure (ζ) one can compute a corresponding z prime statistics:
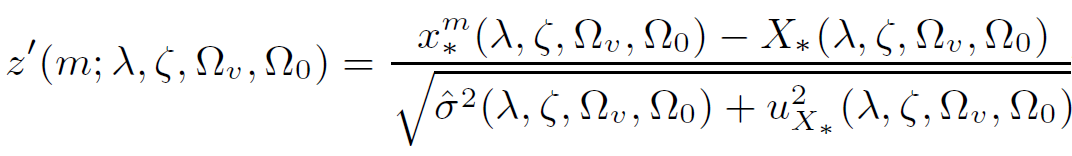
where x is the model simulated BRF, X is the reference BRF under identical conditions, and u is the standard uncertainty of the reference (X) and sigma is the tolerable uncertainty (also known as proficiency standard deviation). While the standard uncertainty of the reference could be determined from a robust analysis (as described in ISO-13528) The proficiency standard deviation was set equal to 3% of the reference X.
Computing the z' statistics for each one of the simulated BRF quantities allows to group them into different categories, where z' < 2 indicates compliance with the tolerance uncertainty (green colour in bar plots below), 2 < z' < 3 indicates a warning sign according to ISO-13528 (gold colour in bar charts below), and z' > 3 indicates an 'action sign' according to ISO-13528 (red colour in bar chart below).
The bar charts below indicate the relative fractions of z' statistics obtained by different models when simulating total BRFs for the heterogeneous abstract canopy cases (white colour indicates that some results are missing).


The bar charts below indicate the relative fractions of z' statistics obtained by different models when simulating single-collided BRFs for the heterogeneous abstract canopy cases (white colour indicates that some results are missing).

The bar charts below indicate the relative fractions of z' statistics obtained by different models when simulating multiple-collided BRFs for the heterogeneous abstract canopy cases (white colour indicates that some results are missing).

The various testcases that are defined within this phase of the RAMI initiative can be visualized on their respective description pages: