
Local uncollided transmission at lower boundary for direct illumination from finitesized sun
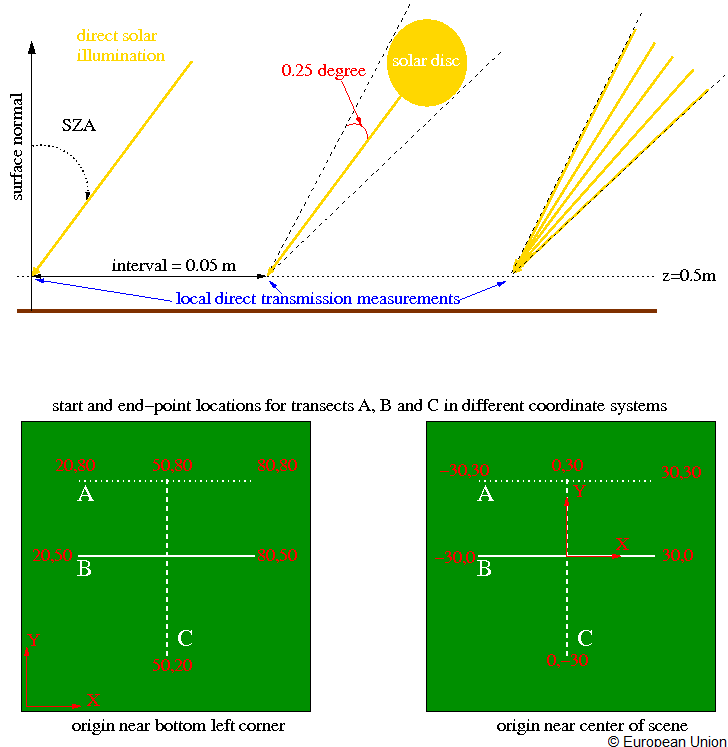
This is the transmission of light originating within the solar disc that traverses the canopy unhindered down to some reference x,y location (within the canopy scene) at a height level of 0.5 m above the background surface (it is thus similar to the direct transmission estimates of the TRAC instrument, for example). Three different transects of such direct transmissions are to be generated. To account for the physical size of the solar disc all incident directions that lie within 0.25 degree of the solar illumination direction are to be included in these local direct transmission estimates. Furthermore the flux density of the radiation is to be assumed uniform 1) across the solar disc and 2) across the top-of-canopy level of the RAMI scene of interest. The ftran_loc measurement applies to all RAMI scenes that are at least 1 hectare in area (i.e., HOMOGENEOUS ABSTRACT canopies are thus excluded).
The sun position should be adopted from the brfpp's geometry table, for the O06 (560nm) band only.
More specifically, ftran_loc prescribes three different transects located at a height of 0.5 metres within the canopy scene and composed of 1201 local direct transmission measurements carried out at 5 cm interval. In the hypothetical case that a given local transmission measurement point along the transect is actually situated within a tree trunk then obviously the resulting transmission is 0. The location of the three transects is as follows:
RAMI scenes that have the origin of the coordinate system in the lower left corner of the scene
RAMI scenes that have the origin of the coordinate system in the center of the scene
The following graphics provide an overview of the concept of this measurements as well as the labelling of the various transects:
Since ftran_loc measurements are independent of wavelength, and in order to specify the transect location (A,B,C) within the filename itself, the RAMI file-naming convention will have to be adapted. please use the spectral tag to indicate the position of the fisheye camera as follows Therefore, spectral tag is usto indicate the position of the transect as follows: two zeros followed by the letter indicating the location of the transect (e.g., 00A, 00B or 00C) in the measurement filename. This naming strategies then results in the following filenames, for example, HET07_JPS_SUM_00C_z36A090-ftran_loc_raytran.mes for a ftran_loc measurement along transect C in the Jaervselja pine stand and HET07_JPS_SUM_00C_Z50A900-ftran_loc_raytran.mes for a ftran_loc measurement along transect A in the Wellington citrus orchard if the sun is located at a $\theta_i=50^\circ$ and has an $\phi_i=90$. Similarly, one should use HET07_JPS_SUM_00C_z20a090-ftran_loc_raytran.mes for the ftran_loc measurement applied to transect B in the heterogeneous abstract canopy HET10_DIS_UNI with illumination conditions having an SZA of 20 degrees.
| Header line content | Header line format |
|---|---|
| # rows in file (# of local transmission estimates) | %4d |
| # columns in file | %4d |
| height of transmission measurements [m] | %.6f |
| Body lines content | Body lines format |
|---|---|
| X coordinate of local transmission estimate [m] | %.2f |
| Y coordinate of local transmission estimate [m] | %.2f |
| ftran_loc | %.6f |
The order in which the transmission values are to be reported in transects A and B is by starting with from the smallest X coordinate value and going towards the largest X coordinate value. For transect C one starts with the smallest Y coordinate value and moves towards the largest Y coordinate value.
Transect A in the case of a RAMI scene having the origin of the coordinate system near the center of the scene.
3603	3	0.500000
-30.00	80.00	0.668422
-29.95	80.00	0.678422
-29.90	80.00	0.688422
....
....
79.85	80.00	12.638422
79.90	80.00	12.648422
79.95	80.00	12.658422
20.00	50.00	12.678422
20.05	50.00	12.688422
20.10	50.00	12.698422
....
....
79.90	50.00	24.658422
79.95	50.00	24.668422
80.00	50.00	24.678422
50.00	20.00	24.688422
50.00	20.05	24.698422
50.00	20.10	24.708422
....
....
50.00	79.90	36.668422
50.00	79.95	36.678422
50.00	80.00	36.688422

or

3603	3	0.500000
-30.00	30.00	0.668422
-29.95	30.00	0.678422
-29.90	30.00	0.688422
....
....
29.90	30.00	12.648422
29.95	30.00	12.658422
30.00	30.00	12.668422
-30.00	0.00	12.678422
-29.95	0.00	12.688422
-29.90	0.00	12.698422
....
....
29.90	30.00	24.658422
29.95	30.00	24.668422
30.00	30.00	24.678422
0.00	-30.00	24.688422
0.00	-29.95	24.698422
0.00	-29.90	24.708422
....
....
0.00	29.90	36.668422
0.00	29.95	36.678422
0.00	30.00	36.688422