
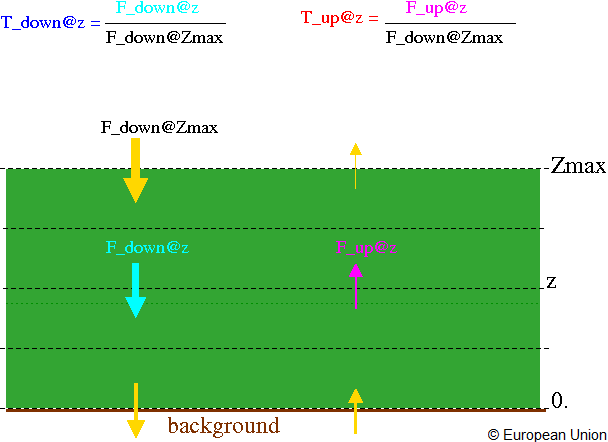
Vertical profile of total transmission through canopy
This measurement comprises two quantities, namely, the fraction of radiation traveling either upward or downward at 11 precisely defined height levels within the canopy. For each height level z, the up- or downward travelling radiation streams (F_up and F_down, respectively) are normalised by the incident radiation at the top of canopy, i.e., $T_{down}(z) = F_{down}(z) / F_{down}(z_{max})$ and $T_{up}(z) = F_{up}(z)/F_{down}(z_{max})$, where $z_{max}$ defines the top-of-canopy level. The highest of the 11 height levels occurs at $z_{max}$, such that $T_{down}(z_{max}) = 1$, and the lowest height level nominally occurs at 0 m (or just above the underlying background surface).
The actual value of $z_{max}$ is available on the experimental description pages. The interval between the 11 height levels is obtained as $z_{max}/10$. Note that this measurements deals with total (direct and diffuse) transmission profiles. Also note, that since fluxes are defined with respect to some reference plane, all of the above quantities have to pass through virtual reference surfaces at height levels $z$ and $z_{max}$. Such a (virtual) reference surface covers the entire spatial extent of a given scene and is oriented parallel to the underlying background surface.
This measure applies to all scene in RAMI-V and only the bands included in the Photosynthetically Active Radiation (PAR) spectral region (400-700 nm). Hence in RAMI-V they are O03 (442.5nm), O04(490nm), O06(560nm), O08(665nm), O10(681.25nm).
Illumination to be considered are either direct illumination as defined in brfpp, as well as isotropic diffuse.
| Header line content | Header line format |
|---|---|
| # rows | %4d |
| # columns in file | %4d |
| heigth level interval | %.6f |
| Content | Format |
|---|---|
| height level [m] | %.6f |
| upward relative flux [-] | %.6f |
| downward relative flux [-] | %.6f |
Order of output in file should be such that the first row relates to the fluxes at the top-of-canopy height level and the last row relates ot the fluxes at the bottom-of-canopy heigth level.
11	3	0.411330
4.113300	0.141735	1.000000
3.705664	0.141582	0.999122
3.293911	0.141189	0.995436
2.882158	0.137624	0.966222
2.470405	0.127586	0.883906
2.058651	0.120395	0.792309
1.646898	0.117929	0.720247
1.235145	0.121600	0.674629
0.823392	0.129983	0.645828
0.411638	0.136868	0.637807
0.000003	0.137448	0.637460