Go to top
European Commission logo
English
RAMI website

Topography

RAMI3 phase

A large number of non-overlapping tree-like entities (composed of a conically shaped crown located above a cylindrical trunk) were randomly located across (and only partially covering) a Gaussian shaped surface that represented the underlying soil topography.

The finite sized foliage was randomly distributed within the conical volumes that represented the tree crowns, and was characterized by its specific radiative properties (reflectance, transmittance), and the orientation of its scatterer-normals (uniform distribution). The radiative properties of the underlying soil were specified (in this case a simple Lambertian scattering law) to reflect ideal winter conditions, ie. snowcover. To address the needs of different RT models, we are providing both a statistical scene description, as well as, a file with the exact spatial coordinates of every tree location (at the level of the soil). You may or may not make use of this information depending on the needs of your particular model.

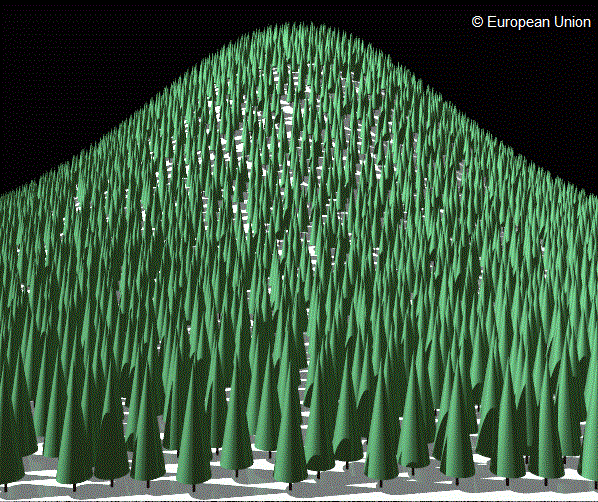
From across its eastern edge in an westward direction towards the centre of the scene
The figures exhibits a graphical representation of this scene looking from across its eastern edge in an westward direction towards the centre of the scene.
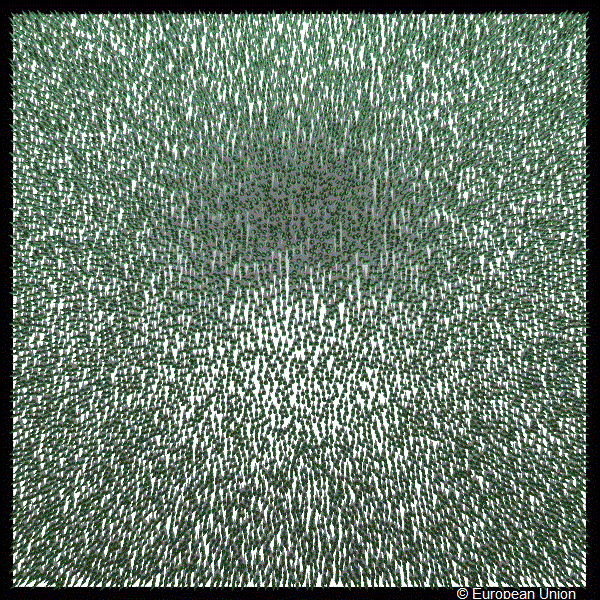
Vertically down towards the centre of the scene
The figures exhibits a graphical representation of this scene looking vertically down towards the centre of the scene.
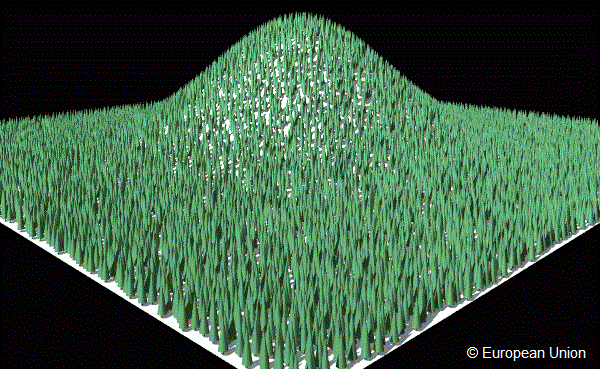
From its south-east border in a north-western direction (diagonally) towards its centre
The figures exhibits a graphical representation of this scene looking vertically down towards the centre of the scene.
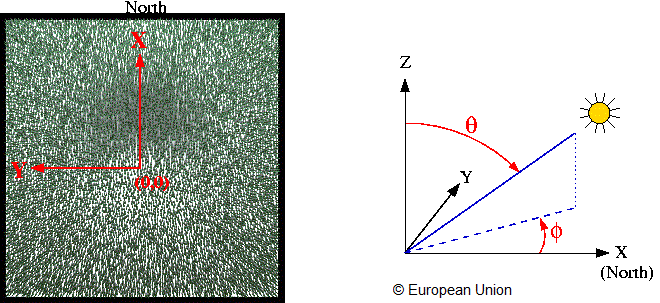
The zero azimuth line
The figures exhibits the zero azimuth line was defined along the northern direction and coincides with the negative X-axis.

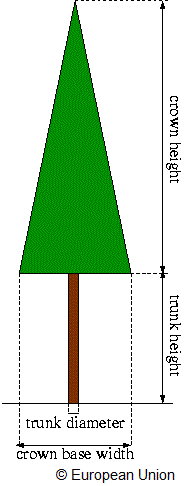
The architecture of this scene contains tree-like entities that are composed of a conical crown on top of a cylindrical trunk. Note that these geometrical primitives do not overlap and that they remain the same for all trees that are populating the scene.

Topography scene architecture.
  • Within the scene the X,Y location of these tree-like entities is generated in a random manner (Poisson distribution). For a given X,Y position the elevation of the soil just underneath the lower part of the tree-trunk (Z) is then computed using the elevation formula given in the table below.
  • This formula provides a Gaussian shaped heightfield that has its maximum elevation value at the (X,Y) origin of the scene (ie., at the scene center) and elevation values very close to zero at the edges of the scene. The underlying substrate (which is represented by this Gaussian shaped heightfield) is thus occupying the entire lower X,Y dimensions of the scene.
  • An ASCII file with the centre coordinates (Xc,Yc,Zc) of every tree in the scene (at the level of the underlying surface) can be found here. This file (is ~ 0.24 Mbytes and) contains 10000 lines of format Xc Yc Zc and may serve as input to your scene creation process (potential users of this file should note, however, that due to the finite width of the tree trunks they will remain partially above/within the Gaussian shaped substratum - it thus may be best to reduce the Zc coordinate in the file by say 1m to assure a full immersion of the bottom of the tree trunks within the underlying soil). Alternatively users may base their RT simulation on the following information regarding the overall characterisation of the scene architecture:

Scene dimensions: ( ΔX × ΔY × ΔZ)500.0 × 500.0 × 113.5 [m × m × m]
(Xmin, Ymin, Zmin)−250.0, -250.0, 0.0 [m, m, m]
(Xmin, Ymax, Zmin)−250.0, +250.0, 0.0 [m, m, m]
(Xmax, Ymin, Zmin)+250.0, -250.0, 0.0 [m, m, m]
(Xmax, Ymax, Zmin)+250.0, +250.0, 0.0 [m, m, m]
(Xmin, Ymin, Zmax)−250.0, -250.0, 113.5 [m, m, m]
(Xmin, Ymax, Zmax)−250.0, +250.0, 113.5[m, m, m]
(Xmax, Ymin, Zmax)+250.0, -250.0, 113.5[m, m, m]
(Xmax, Ymax, Zmax)+250.0, +250.0, 113.5[m, m, m]
Scatterer shapeDisc of negligible thickness
Scatterer radius0.05 [m]
LAI of individual tree crown (cone)5.0
Scatterer normal distribution in tree crownUniform
Number of trees in scene10000
Spatial distribution of tree locations (X,Y) in sceneRandom (Poisson Distribution)
Stem density [tree/hectare]400
Fractional scene coverage of cones0.4072
LAI of scene2.0358
Tree crown height12.0 [m]
Tree crown-base width3.60 [m]
Tree trunk height1.50 [m]
Tree trunk diameter0.30 [m]
Elevation formula (Zsoil, X, Y & MaxEl in [m])Zsoil = MaxEl ⋅ exp( −[(X ⁄ 100.0)² + (Y ⁄ 100.0)²] )
Maximum Elevation (MaxEl)100.0 [m]
Max. Elevation Coordinates (X,Y)(0.0,0.0)